Before the open, at 10:15, and on the daily chart: which signals actually changed what kind of day NIFTY had — measured on 696 sessions, checked in two separate halves, and shown with the tools that read them live.
Every session in this module is classified after the close. A trend day closes at least 0.8% from its open on an efficient path (efficiency 0.6 or more). A range day covers 0.7% or less with no direction. Everything else is mixed. On non-expiry sessions since 2023-03-29, 14% were trend days, 19% range days and the rest mixed — the average day covered 0.89%.
Trend day: closed at least 0.8% from the open with an efficient path. Range day: total range 0.7% or less with no direction. Everything else is mixed. Most of the year is grey.
The classification comes after the fact. The question for the rest of the module is how much of it could be seen in advance.
The simplest pre-open signal is yesterday. Trend days almost never repeat in the same direction: of 130 trend days, only 6 were followed by another trend day the same way. After a down trend day the next session was more often an up trend day (14%) than another down one (6%).
| Today was… | Next: up trend day | Next: down trend day | Next: range day | Next: mixed day |
|---|---|---|---|---|
| Up trend day (57) | 4% | 11% | 14% | 72% |
| Down trend day (73) | 14% | 6% | 6% | 75% |
| Range day (153) | 4% | 7% | 22% | 67% |
| Mixed day (600) | 7% | 9% | 18% | 67% |
Rows: what today was. Columns: what the next session became. Sessions in brackets. Darker cells are more frequent.
Trend days cluster: when one arrives, the next often follows within days, though rarely the very next session in the same direction. Then come long quiet stretches.
These signals are all known by 09:00. The strongest ones describe how big the day is likely to be, not which way it will go. Quiet conditions — VIX in the bottom quarter of its year, yesterday’s range under 0.7%, or 11+ sessions since the last trend day — came with average ranges of 0.69%, 0.74% and 0.69%. Loud ones — yesterday’s range of 1.5% or more, a CPR 0.35% or wider, a gap down of more than 0.5% — left only 7%, 9% and 7% range days.
Pick a signal, then an outcome. Bars are the share of sessions that turned out that way; the dashed line is all sessions. Green bars beat the base rate, red fall short.
The daily chart sets the background. A daily downtrend (Supertrend down, price below the 21 and 50 EMAs, ADX 20 or more) brought 25% trend days and an average range of 1.12%; a daily uptrend brought 5% trend days and 0.77%. Uptrends grind; downtrends swing. Neither said much about the direction of the next day.
Levels matter in a less obvious way. The day after NIFTY closed above its 20-day high, only 6% of sessions were trend days and 26% were range days — and 61% closed below their open. Sitting just under the 20-day high, 8% were trend days. Breakouts tend to pause the next day; they do not follow through on schedule.
All measured at yesterday’s close, so known before today’s open.
At 10:15 the first hour is on the screen, and the odds move more than anything before the open could move them. A morning that scores 4 of 5 on the trend checklist became a trend day 47% of the time, and the rest of its session continued the morning’s move 67% of the time (all days: 51%). A first hour already 0.9% wide became a trend day 43% of the time.
The honest test is what happens after 10:15, because the same-day outcome partly restates the morning itself. On that test the first hour still tells you about the size of the rest of the day; it does not tell you its direction.
Start with “Rest of day continued” and “Move after 10:15” — outcomes that start after the reading, so they do not overlap with what was already seen.
Indicators on the 5-minute chart are built from the same prices as the first-hour read, so they mostly repeat it. Supertrend on the side of the morning’s move: 15% trend days. The 9, 21 and 50 EMAs stacked in its direction: 15%. All days: 14%. Use them to stay in a trade that the price read already justified, not to find the day.
The same outcomes, sorted by the indicators instead of by price. Compare the spread of the bars with the first-hour explorer above.
Two pre-open conditions together sometimes say more than either alone. The table keeps only combinations that beat both of their parts, held in both halves of the data, and had at least 30 sessions. Treat them as hypotheses to watch, not rules: with this many combinations tested, a few would pass by chance.
| Both true before the open | Outcome | Rate | 2023–24 / 2025–26 | Sessions |
|---|---|---|---|---|
| after a down trend day + daily no trend | closed above open | 74% vs 50% | 79% / 67% | 34 |
| after a down trend day + weekly up | closed above open | 73% vs 50% | 73% / 73% | 33 |
| not NR7 + at support (20d low) | closed above open | 71% vs 50% | 80% / 68% | 35 |
| NR7 yesterday + 3-5 days since | closed above open | 28% vs 50% | 33% / 24% | 32 |
| after a mixed day + 3 up closes | range days | 40% vs 19% | 53% / 23% | 30 |
| 1 up close + 3-5 days since | closed above open | 30% vs 50% | 39% / 24% | 30 |
| CPR 0.10-0.20% + VIX top quarter | trend days | 33% vs 14% | 36% / 30% | 58 |
| flat open (±0.2%) + at resistance (20d high) | range days | 37% vs 19% | 45% / 19% | 54 |
| daily downtrend + 1-2 days since trend day | trend days | 32% vs 14% | 20% / 36% | 38 |
| prev range 0.7-1% + VIX top quarter | trend days | 31% vs 14% | 35% / 27% | 51 |
| prev range <0.7% + VIX 25-50 pctl | range days | 35% vs 19% | 41% / 28% | 66 |
| VIX top quarter + 1 up close | trend days | 30% vs 14% | 36% / 24% | 50 |
Put the module to work. Choose what you knew this morning and see every past session that looked the same before the open — what kind of day it became, and the dates to replay in Options History.
Each answer narrows the history to the sessions that looked the same before the open. Fewer than 20 matches is a set of examples, not odds.
Four sessions. In the first, the pre-open card pointed to a wide day while 10:15 looked mixed. In the next two, card and 10:15 agreed and the day followed. In the last, both pointed to a quiet day — and NIFTY trended. For each: read the pre-open card, make the call, then let the 10:15 chart and the rest of the day answer.
What was known at 09:00, each with what followed it across every session since 2023 (all days: 14% trend, 19% range, 0.89% average range).
The chart stops at 10:15 — everything a trader could know at that moment. Decide first, then reveal.
The read at 10:15. No clean profile: mixed signals at 10:15 — the morning that most often calls for standing aside.
NIFTY finished +1.61% from its open with a 2.09% range — a trend day. Press “Reveal the rest of the session” on the chart to watch it unfold.
What was known at 09:00, each with what followed it across every session since 2023 (all days: 14% trend, 19% range, 0.89% average range).
The chart stops at 10:15 — everything a trader could know at that moment. Decide first, then reveal.
The read at 10:15. Morning profile of a range day: narrow first hour, price inside the box, the straddle decaying.
NIFTY finished +0.04% from its open with a 0.32% range — a range day. Press “Reveal the rest of the session” on the chart to watch it unfold.
What was known at 09:00, each with what followed it across every session since 2023 (all days: 14% trend, 19% range, 0.89% average range).
The chart stops at 10:15 — everything a trader could know at that moment. Decide first, then reveal.
The read at 10:15. Morning profile of a trend day: wide first hour, price at an edge, the straddle not decaying.
NIFTY finished +1.40% from its open with a 1.74% range — a trend day. Press “Reveal the rest of the session” on the chart to watch it unfold.
What was known at 09:00, each with what followed it across every session since 2023 (all days: 14% trend, 19% range, 0.89% average range).
The chart stops at 10:15 — everything a trader could know at that moment. Decide first, then reveal.
The read at 10:15. No clean profile: mixed signals at 10:15 — the morning that most often calls for standing aside.
NIFTY finished −1.56% from its open with a 2.04% range — a trend day. Press “Reveal the rest of the session” on the chart to watch it unfold.
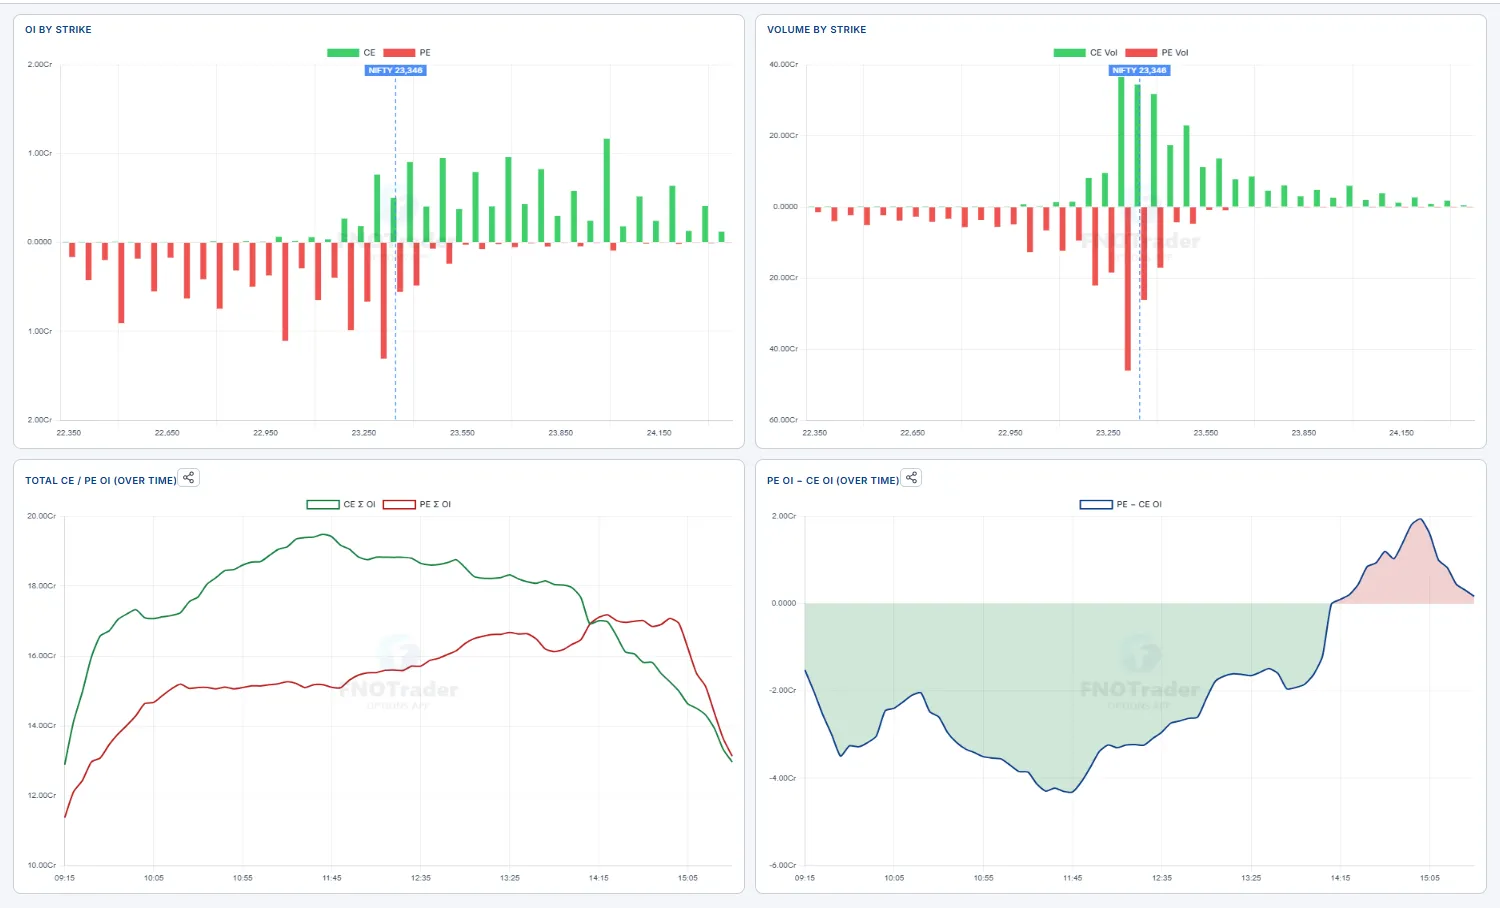
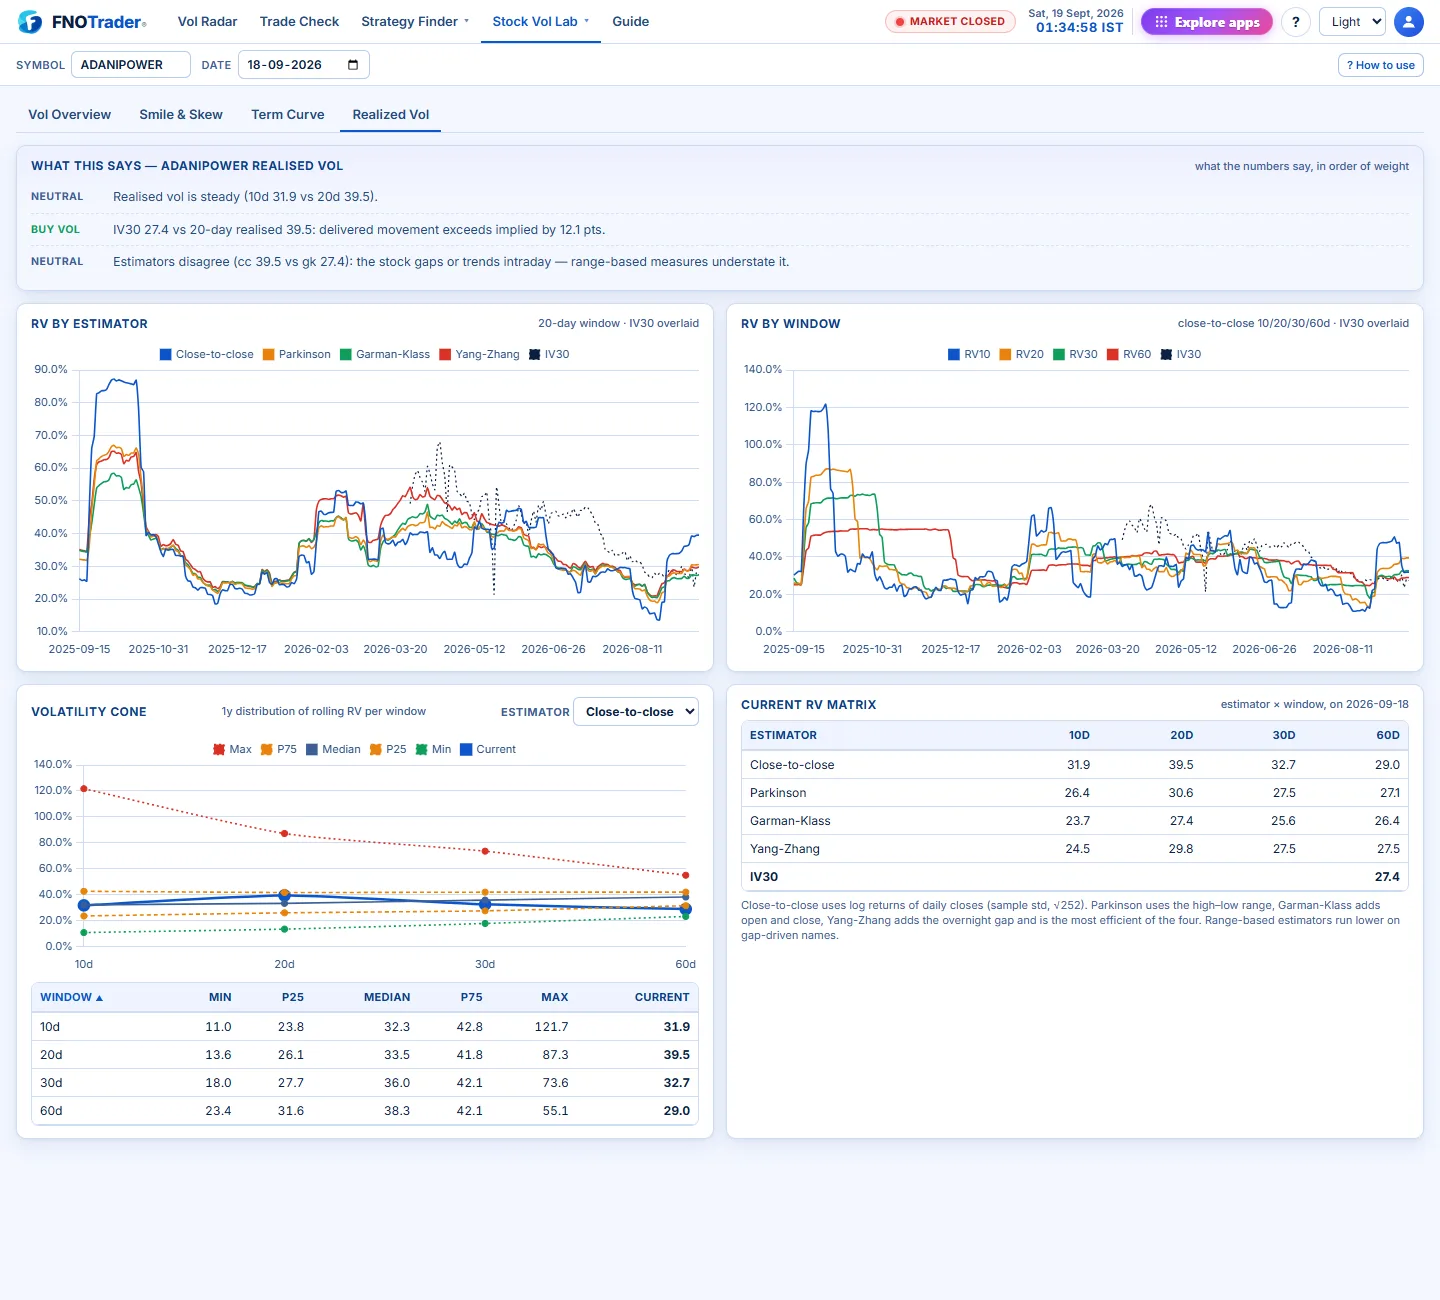
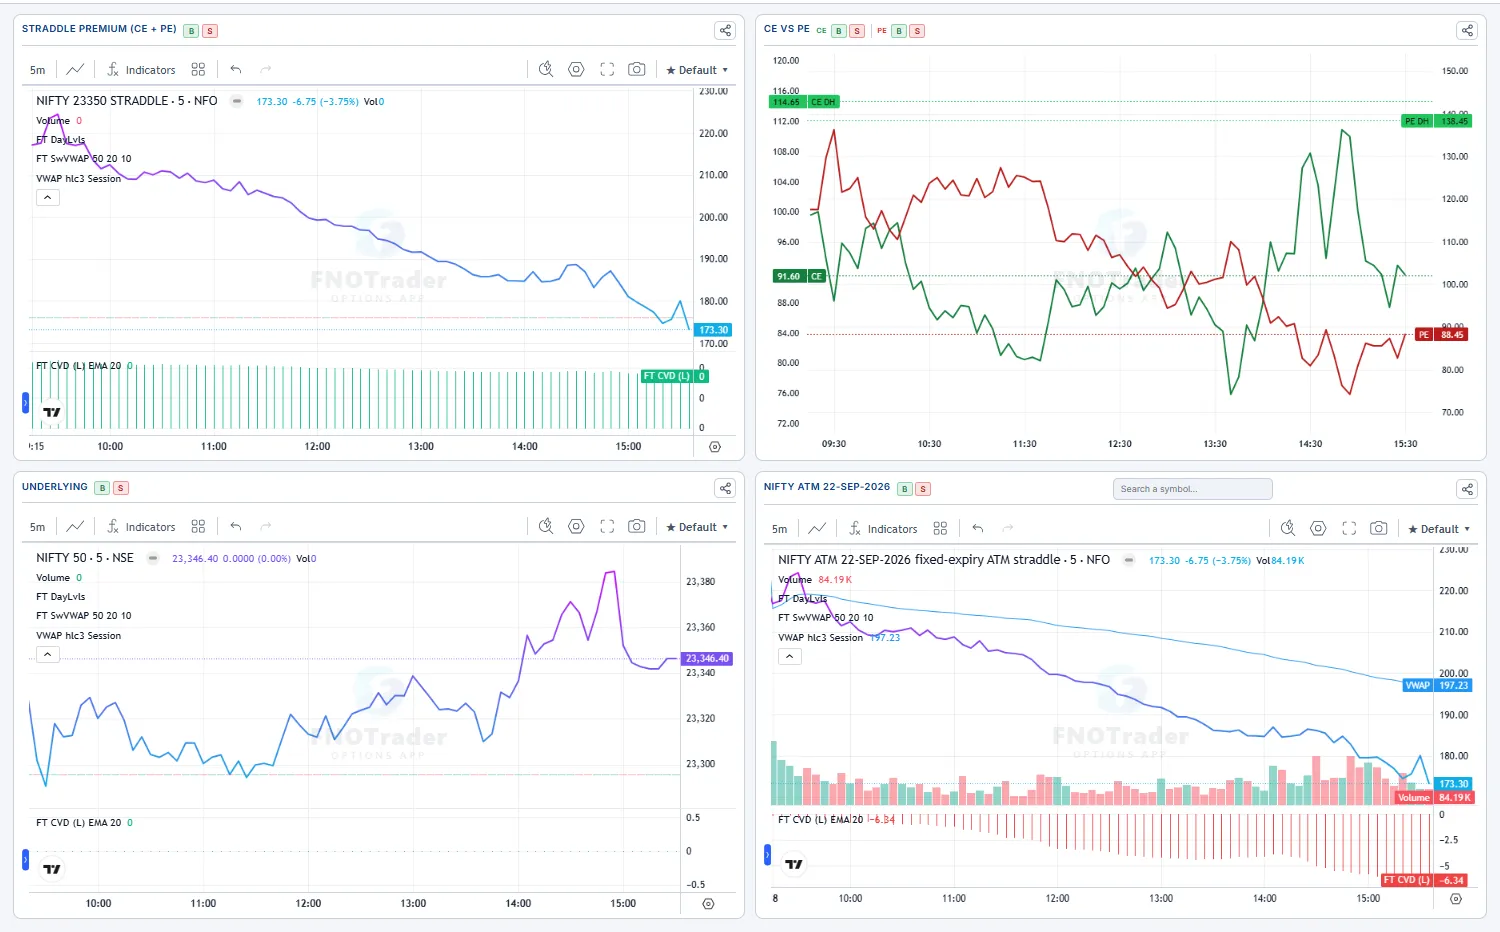
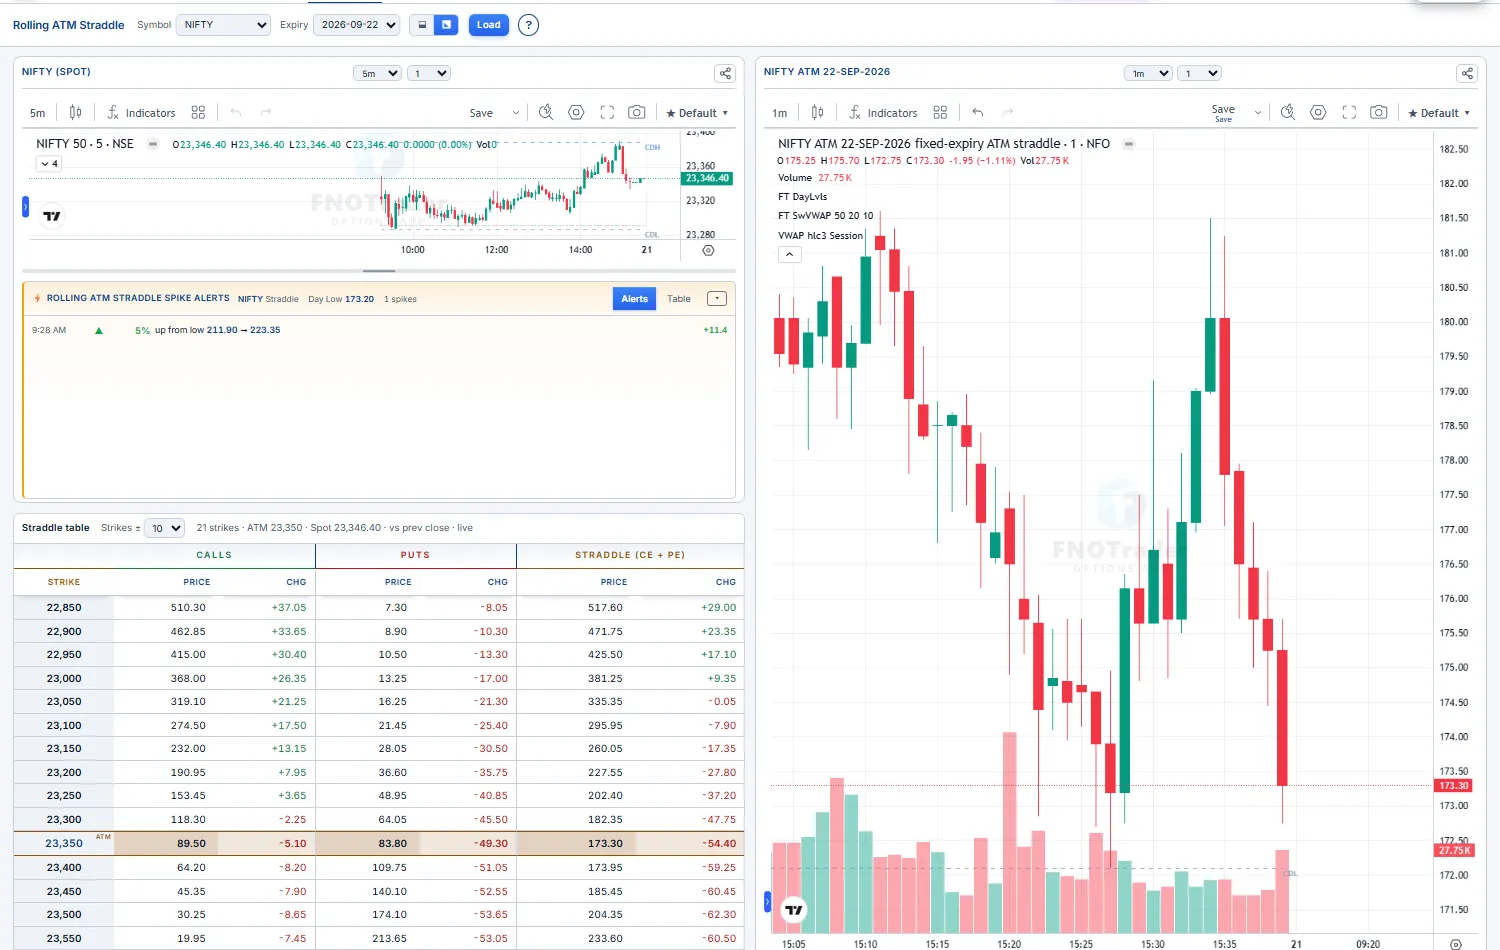
Each question in this module has a page in FNOTrader that answers it live, and in Options History for any past session.
The question it answers. Is implied volatility above or below what the index is actually delivering — is premium rich or cheap?
When the blue line (what options charge) sits above the orange one (what NIFTY delivered over the last 20 sessions), premium is rich — the seller’s tailwind and the buyer’s headwind.
The question it answers. Is the market paying up for a move today, or selling it off? The ATM straddle against its own session VWAP answers that in one line.
The question it answers. What does the market charge for a move right now, at whatever strike is at the money? It re-anchors as NIFTY moves, so it reads like a volatility chart.
The question it answers. Are calls or puts being written faster through the day, and which way is the put-call ratio leaning?
Yesterday’s type and range, the gap, VIX against its year, the daily trend and the 20-day level. It sets the expected size of the day.
Let the first hour print. Watch the straddle against its VWAP and where price sits in its range.
Range so far, efficiency, location, crosses of the open, the straddle. 4 or 5 is a morning worth trading with; 0–1 is a morning to stand aside or fade.
Supertrend and the EMAs help you stay with a move the price read already justified.
Record what the card and the 10:15 score said and what the day became. Your own record is the one that counts.
For a seller the read is about when not to be short: wide mornings, daily downtrends and big previous ranges are where short premium gets run over. Quiet pre-open conditions — low VIX, a narrow yesterday, long since the last trend day — are the seller’s days.
These are frequencies from past NIFTY sessions (2023-03-29 to 2026-10-30), not predictions or recommendations. They describe how often a condition was followed by an outcome; any single day can go the other way, as the fourth practice session shows.
Answer before opening each one.