What this course gives you, the daily routine that turns it into decisions, and the FNOTrader tool that answers each question — shown on real NIFTY sessions.
How premium is priced, what the Greeks do to a position hour by hour, and why implied volatility decides who gets paid — with every concept on an interactive chart.
Every NIFTY session since 2023 classified, and the first-hour read that moves the odds. Standing aside on the wrong day is the first edge.
A 10:15 routine on real sessions: first-hour width, where price sits, what the straddle and the OI are doing. Practise it on charts that stop at 10:15.
Straddle and strangle charts, OI playback, Trending OI, buildup, options flow, GEX, Vol Lab — each shown on a real session, with a link to replay that session in Options History.
Every rule in the course is tested on the full archive, without lookahead and before costs, and the results are shown whether they flatter the rule or not.
Learn here, rehearse on past sessions in Options History, paper-trade on the ₹1 crore demo terminal, then go live small — and review every week.
The same sequence every session. Each step is a question, and each question has one place to look.
Is premium rich or cheap? Vol Lab compares implied with realised volatility and ranks today’s IV against its own year. Rich premium is the seller’s tailwind; cheap premium after a quiet spell is where buyers get paid.
Events the market is already pricing in. Buying ahead of one means buying the expensive version.
Watch the ATM straddle against its VWAP and the first-hour box. The course’s data shows the width of that hour alone moves the odds of a trend day from 4% to 40%.
OI playback, Trending OI and the buildup table tell you who is writing what and where the walls are. Mixed signals are a reason to stand aside, not to force a trade.
Greeks Exposure shows whether dealer hedging will absorb or amplify the move; the straddle chart tells you when the premium regime changes.
The journal groups every trade by setup and day type, so the weekly review is about evidence, not memory.
Three real sessions. Each chart stops at 10:15 with the signals a trader could see; make the call, then reveal the day.
At 10:15 the first hour is known: how wide it was, where price sits in it, and whether the straddle is being bid. This table sorts every session by that morning and shows what the day became — and what two mechanical rules did when entered after 10:15.
| The morning at 10:15 | Sessions | Became trend | Became range | Mixed | Buyer: break of the first-hour box | Seller: short ATM straddle at 10:15 |
|---|---|---|---|---|---|---|
| All non-expiry sessions | 741 | 14.0% | 17.4% | 68.6% | −2.1% (664) | +1.1% (740) |
| First hour under 0.4% | 272 | 4.4% | 32.0% | 63.6% | −2.3% (253) | +1.9% (272) |
| First hour 0.4–0.6% | 279 | 14.0% | 13.6% | 72.4% | −2.2% (253) | +1.9% (279) |
| First hour 0.6–0.9% | 143 | 23.8% | 2.8% | 73.4% | −1.7% (123) | −0.7% (142) |
| First hour 0.9% or more | 47 | 40.4% | 0.0% | 59.6% | −0.3% (35) | −3.2% (47) |
| At an edge, straddle not decaying | 102 | 23.5% | 11.8% | 64.7% | −5.6% (96) | +1.7% (102) |
| Mid-box, first hour under 0.5% | 208 | 8.2% | 26.9% | 64.9% | 0.0% (188) | +2.0% (208) |
Rule results are average % of premium (buyer) or credit (seller) per trade, before costs, trades in brackets. A first hour of 0.7% or more cannot become a “range day” by definition — read that column for narrow mornings only. What the table shows: the morning moves the odds of the day type a great deal, and it works best as a filter for when to stand aside. It does not, on its own, turn a rule into a profitable one.
The chart stops at 10:15 — everything a trader could know at that moment. Decide first, then reveal.
The read at 10:15. Morning profile of a trend day: wide first hour, price at an edge, the straddle not decaying.
NIFTY finished +1.69% from its open with a 1.84% range — a trend day. Press “Reveal the rest of the session” on the chart to watch it unfold.
The chart stops at 10:15 — everything a trader could know at that moment. Decide first, then reveal.
The read at 10:15. Morning profile of a range day: narrow first hour, price inside the box, the straddle decaying.
NIFTY finished +0.04% from its open with a 0.32% range — a range day. Press “Reveal the rest of the session” on the chart to watch it unfold.
The chart stops at 10:15 — everything a trader could know at that moment. Decide first, then reveal.
The read at 10:15. No clean profile: mixed signals at 10:15 — the morning that most often calls for standing aside.
NIFTY finished +0.86% from its open with a 1.00% range — a trend day. Press “Reveal the rest of the session” on the chart to watch it unfold.
Trend day: closed at least 0.8% from the open with an efficient path. Range day: total range 0.7% or less with no direction. Everything else is mixed. Most of the year is grey.
| The question | Where to look | App |
|---|---|---|
| Is premium rich or cheap today? | Realized Vol & IV | Vol Lab |
| Where is premium mispriced across F&O? | Vol Radar | Vol Lab |
| Is the market paying for a move? | Straddle Charts | FNOTrader Options |
| What does a move cost right now? | Rolling ATM Straddle | FNOTrader Options |
| Where are the walls, and how did they build? | Time based Analysis (OI playback) | FNOTrader Options |
| Who is writing calls or puts? | Trending OI | FNOTrader Options |
| Long buildup or short covering at each strike? | Options Buildup | FNOTrader Options |
| Where is unusual volume trading? | Options Flow | FNOTrader Options |
| Will moves be absorbed or amplified? | Greeks Exposure (GEX) | FNOTrader Options |
| Which cheap options are multiplying? | Option Multibaggers | FNOTrader Options |
| What does my structure risk? | Trade Check | Vol Lab |
| Can I execute the plan exactly, and practise first? | Demo & rules | QuikTrade Terminal |
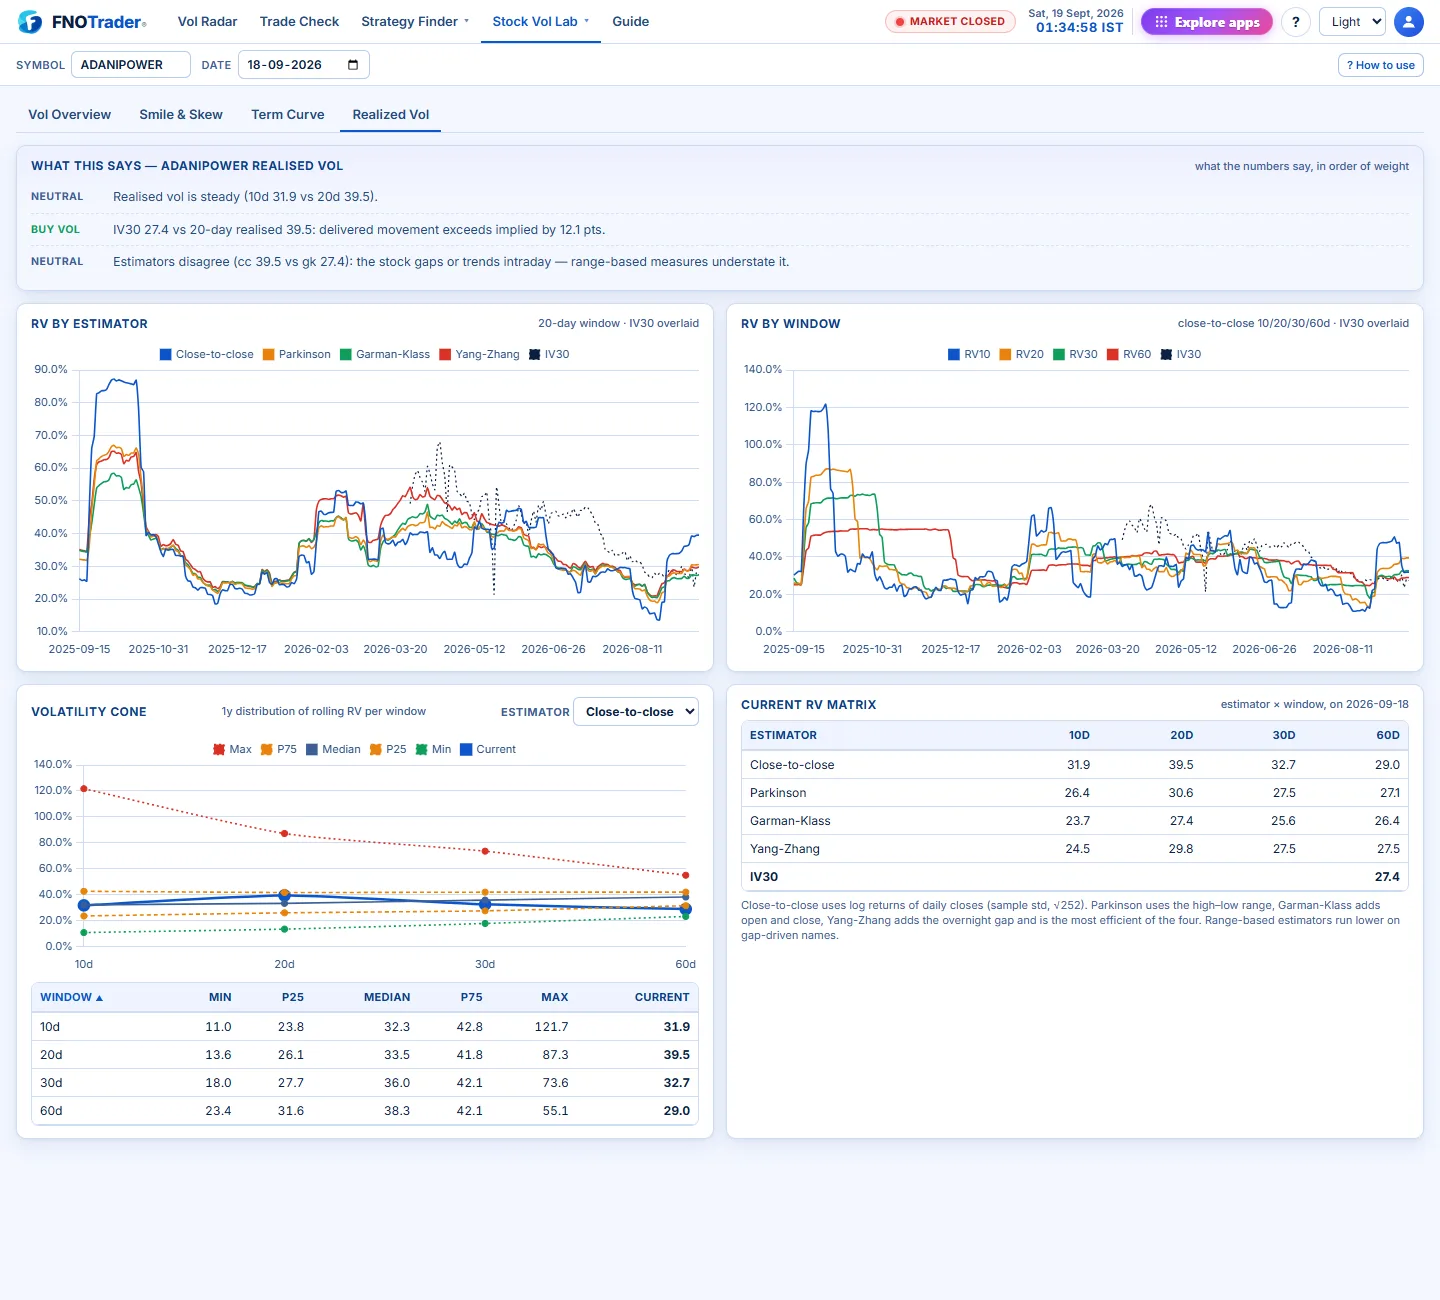
The question it answers. Is implied volatility above or below what the index is actually delivering — is premium rich or cheap?
When the blue line (what options charge) sits above the orange one (what NIFTY delivered over the last 20 sessions), premium is rich — the seller’s tailwind and the buyer’s headwind.
Work through the modules. Every concept has a chart you can move; every claim has the data under it.
Open any session in Options History — the real Options pages with a time slider and Replay — and make the 10:15 call before you let the session play.
Run the plan on the QuikTrade demo with ₹1 crore of paper money: real order flow, stops and targets, no broker needed.
One lot, the risk per trade fixed in advance, the same checklist. Size rises only with evidence from the journal.
By setup and by day type. The numbers decide what stays in the playbook.
What the course cannot do is promise a result. The rule tests in it include ones that lost money before costs; they are shown because knowing what does not work is part of the edge. Results depend on the work put into learning, rehearsing and executing the process — and on the market.
FNOTrader Options (straddle and strangle charts, OI playback, Trending OI, buildup, options flow, GEX), Options History for replaying past sessions, Vol Lab, and the QuikTrade terminal with its paper-trading demo.
See plans →Open Options →Open Vol Lab →